

On a good day, your production line runs like a perfectly tuned machine. On a bad day, a micro-defect slips through, and suddenly you’re dealing with customer complaints, rework costs, and 2 a.m. troubleshooting calls. That gap — between what you think you’re catching and what actually escapes — is exactly where modern object detection in manufacturing is reshaping quality control.
Object detection isn’t theory anymore. It’s not “AI hype.” It’s real, production-ready, and delivering measurable improvements in escape reduction, OEE, and operator efficiency.
But companies seeing the biggest wins aren’t simply bolting on AI. They’re rethinking the entire inspection layer: optics, lighting, data, models, controls, and how everything ties into PLCs and MES.
Let’s break down what’s changing — and what forward-thinking factories are already doing.
What Is Object Detection in Manufacturing?
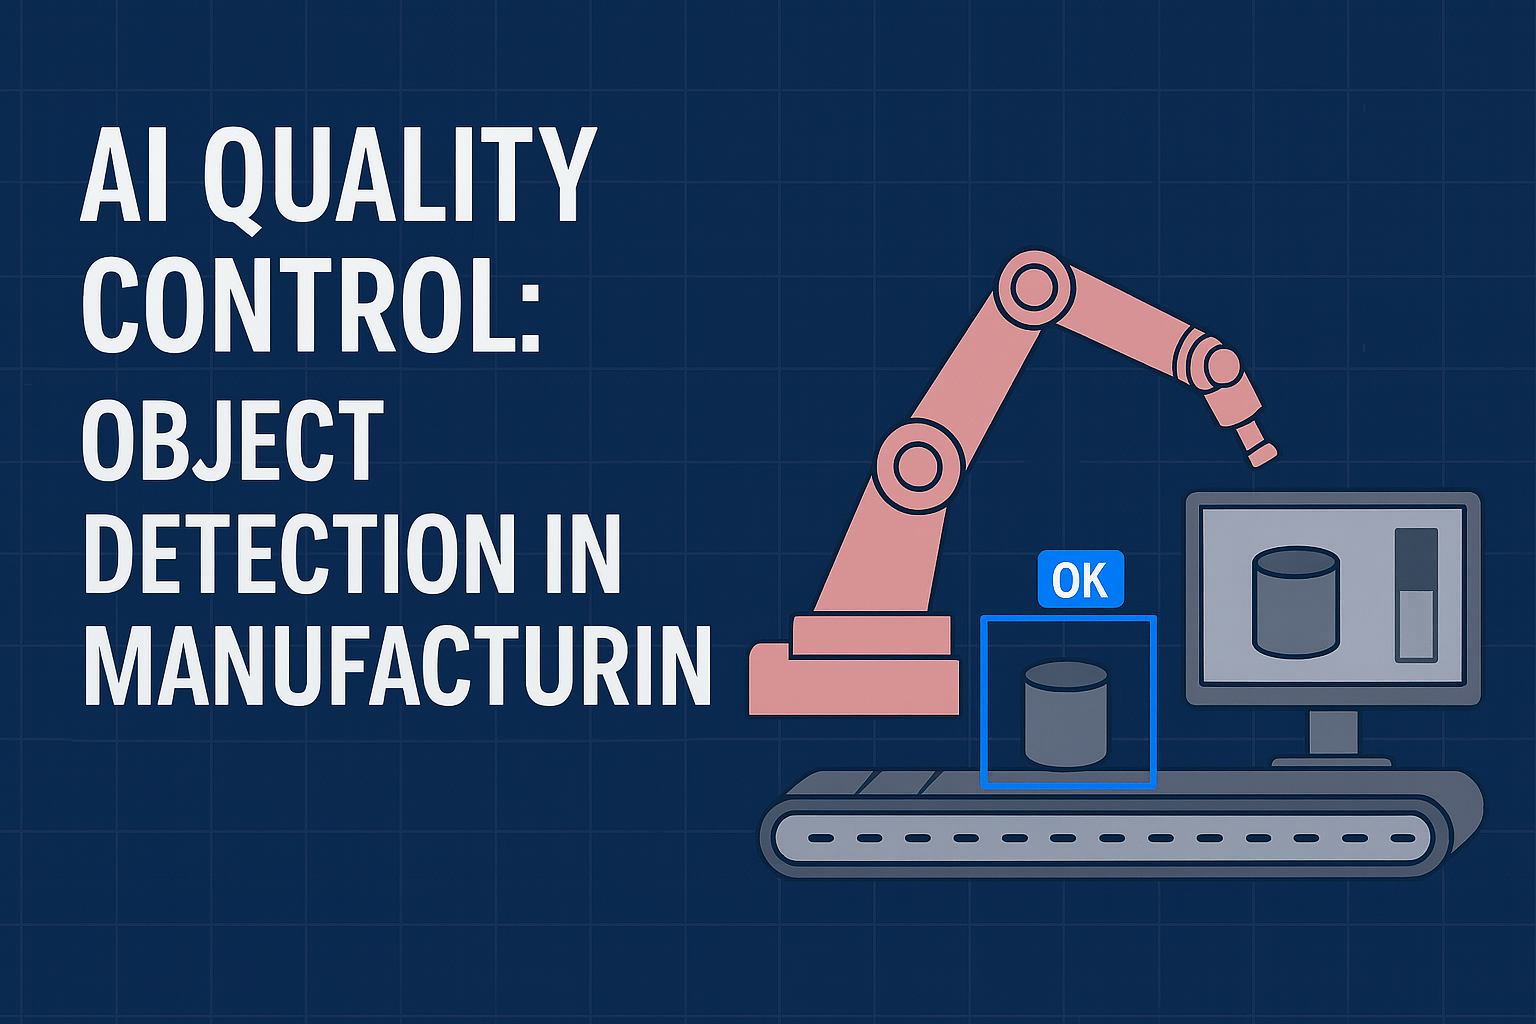
At its core, object detection is a computer vision technique that not only recognizes what’s in an image, but also pinpoints where it is. On a production line, that translates to a system that can spot a missing fastener, a skewed label, or a hairline crack—and tell your PLC exactly where it saw it, in time to sort or stop.
Think of it as the difference between “this part looks wrong” and “there’s no M6 screw in pocket B, top-left quadrant.”
How Object Detection Works (Simplified)
- Input: Images from a camera (often strobe-lit and triggered by a sensor to freeze motion).
- Brain: A deep-learning model trained to recognize specific parts, features, or defects (YOLO/SSD/DETR family, tuned for your use case).
- Output: Bounding boxes with class labels and confidence scores—plus counts, positions, and sometimes orientation.
- Action: Business rules convert those results into pass/fail decisions, which flow to your PLC/MES alongside images and timestamps for traceability.
Detection vs Classification vs Segmentation
In manufacturing quality control, computer vision can tackle problems at different levels of detail depending on the task. Classification is the simplest approach: it answers the question, “Is this part good or bad?” Here, the system looks at the whole image and assigns a single label, making it ideal for straightforward pass/fail checks or verifying the correct variant of a product—for instance, confirming that a bottle has the right flavor label.
Object detection takes things a step further. Instead of just telling you if a part is okay, it identifies what’s present and precisely where it is. By drawing boxes around items or defects and assigning confidence scores, it allows operators to locate missing screws, misaligned connectors, or incorrectly colored caps. This approach is particularly useful when you need to count items, verify kits, or track the placement of multiple components in a tray.
For tasks that demand the highest level of precision, segmentation maps out the exact boundaries of each feature or defect. The system produces pixel-accurate shapes that reveal tiny scratches on metal, coverage of sealant beads, paint chips, or solder bridges. Segmentation is perfect for surface inspections or any scenario where knowing the exact size, shape, or area of a defect matters.
In practice, many production lines combine these techniques: classification for a quick initial screen, object detection to localize and count parts, and segmentation for fine-grained inspection where precision is critical. This layered approach ensures both speed and accuracy without overwhelming operators or slowing down the line.
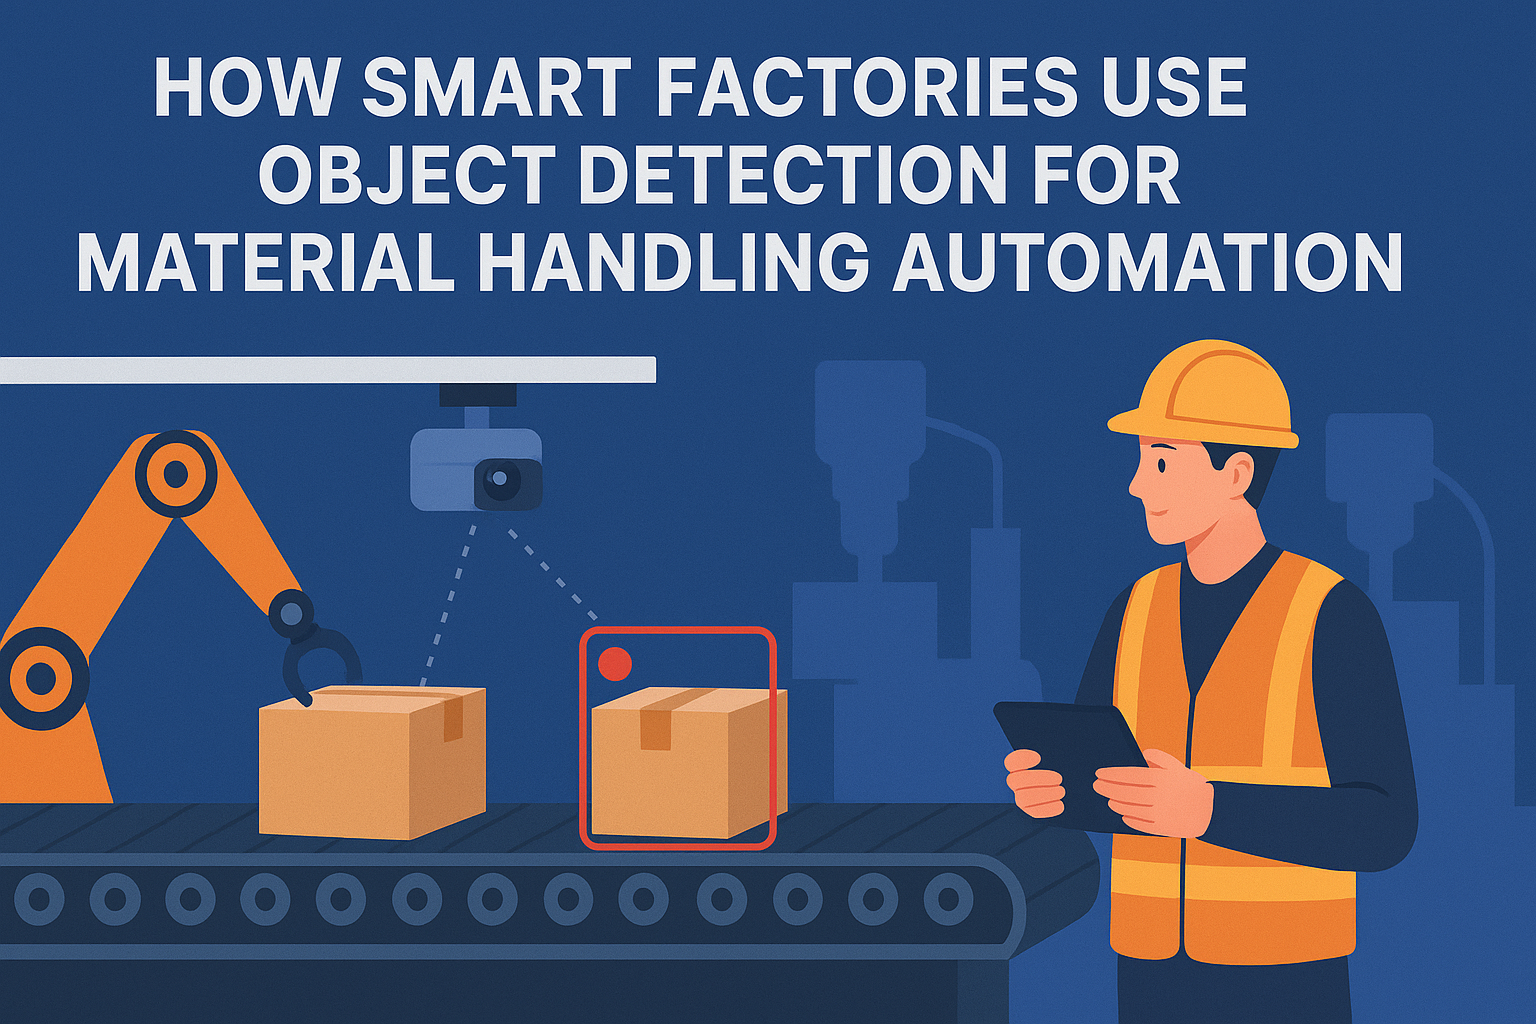
Where Object Detection Fits in a Factory Workflow
- A sensor fires; the camera grabs a sharp frame under controlled lighting.
- The model runs at the edge (industrial PC or Jetson-class device) in tens of milliseconds.
- Post-processing filters overlapping boxes (non-maximum suppression), applies thresholds, and maps detections to known regions.
- The station returns pass/fail, defect type, and coordinates to the PLC; images and metadata land in your MES or quality data lake.
Where It Struggles (and How to Help It)
- Physics limits: If a defect is smaller than your pixel budget or hidden by glare, the model can’t invent detail. Tighten field of view, upgrade optics, or change lighting.
- Motion blur: Use global shutters and strobed lighting to freeze fast movers.
- Sparse defect data: Start with a lean, well-annotated set, include “near misses,” and plan for continuous data capture and retraining. For truly rare issues, consider anomaly detection as a complement.
The Metrics That Actually Matter
- Precision/recall map to overkill (false positives) and escapes (false negatives).
- Latency and uptime determine whether you hit cycle time without creating a bottleneck.
- Traceability: Every decision tied to a serial number, with image evidence and model version, keeps quality and compliance teams happy.
Bottom line: object detection gives your line a reliable set of eyes that can point to the exact issue in real time. When you pair it with good optics, sound labeling, and tight PLC/MES integration, it becomes a high-leverage way to reduce escapes, cut overkill, and make quality decisions you can trust.
Benefits of AI Object Detection for Quality Control
Quality teams don’t just want prettier dashboards—they want fewer 2 a.m. calls and smoother shift handoffs. AI object detection delivers both, turning every camera into a fast, consistent decision-maker that plays nicely with your PLC/MES. It’s not magic — it’s physics plus machine learning, working together at the edge.
- Fewer escapes: Deep-learning features catch subtle defects; tune thresholds toward recall for safety-critical parts.
- Less overkill: Consistent decisions cut unnecessary rework and scrap, lifting OEE and morale.
- Throughput without bottlenecks: Edge inference in <100 ms keeps pace with high-speed conveyors.
- Resilience to variation: Handles supplier changes, cosmetic shifts, and mixed-model runs better than brittle rules.
- Operator clarity: On-screen annotations show defect type and location, reducing debate and rechecks.
Compounding Advantages
- Continuous improvement: Auto-capture images and outcomes, retrain on edge cases, and roll out better models safely.
- End-to-end traceability: Store images, metadata, and model versions by serial number—audit-ready for Part 11/Annex 11.
- Faster changeovers: Recipe-based configs switch SKUs without reprogramming; caps, labels, and kit counts adapt in seconds.
- Process intelligence: Trend defect hotspots, correlate with shift/tooling, and flag drift before escapes spike.
- Scalable architecture: Standard cameras/compute, APIs (OPC UA/MQTT/REST), and centralized monitoring replicate across cells.
The payoff is practical: fewer customer claims, steadier cycle times, and a measurable drop in cost of poor quality—often with a payback measured in months, not years.
Why Quality Control Needs a Rethink
- Speed: Lines run faster than ever; humans fatigue, cameras don’t.
- Variability: New suppliers, new coatings, mixed-model lines — all stress old rule-based systems.
- Expectations: Customers expect zero-defect quality; regulators expect traceability.
- Cost: Every false reject (overkill) hurts OEE; every miss (escape) hurts your brand — and your bottom line.
Traditional machine vision is still great for structured features: edge finding, gauging, barcode reading. But when parts vary, lighting shifts, or defects are subtle, deep-learning-based object detection provides the robustness you need.
What Object Detection Actually Does (And What It Doesn’t)
Think of “object detection” as the system pointing to “what” and “where” in an image. It draws bounding boxes around items or defects and assigns confidence scores. It’s different from classification (Is this OK or not?) and from segmentation (pixel-precise masks). Often, you’ll use them together.
|
Vision Task |
Use It For |
Output |
Example on the Line |
|
Classification |
Pass/fail at part level |
Single label |
Good vs. bad bottle |
|
Object detection |
Presence/absence, counting, localization |
Boxes + confidence |
Missing fastener, wrong cap color |
|
Segmentation |
Surface defects, precise boundaries |
Pixel mask |
Scratches on anodized aluminum, solder bridges |
|
3D detection |
Height/warp, depth-aware checks |
3D bounding/point cloud cues |
Warped lids, bent pins, volumetric fill |
What it doesn’t do: read your mind. If optics are poor or the defect is smaller than your pixel resolution, no model can rescue you. Fix what you can in the physical world first.
How It Works on the Line
A production-ready setup usually looks like this:
- Trigger and acquisition: A sensor triggers the camera at the right moment to avoid motion blur.
- Lighting and optics: Strobes, backlights, polarizers, or telecentric lenses make the relevant features pop.
- Inference at the edge: A model (e.g., YOLO, SSD, DETR variants) runs on an industrial PC or edge AI module (think Jetson/Intel).
- Decision and handshake: The system returns pass/fail plus metadata to the PLC/SCADA or MES for gating, sorting, or rework.
- Feedback loop: Images and outcomes are logged for retraining, audits, and continuous improvement.
Most plants aim for under 100 ms from trigger to decision. At 300 parts/min, that margin matters.
Hardware That Makes the Software Accurate
Choosing the Right Industrial Camera:
- Global shutter for motion; line-scan for continuous materials; color when color is a feature, mono when it isn’t.
Lens Selection Based on Field of View
- Telecentric for critical measurements (no magnification error); standard C-mount for general tasks.
Lighting Techniques That Improve Detection
- Backlight for silhouette and edge integrity
- Darkfield for surface scratches
- Cross-polarized to tame glare
- NIR/UV for coatings and inks
Edge Devices & Vision Controllers
- 3D sensors: Structured light or laser triangulation when height matters.
Importance of Rigidity & Proper Fixturing
- Edge inference for low latency; cloud for model training and fleet monitoring.
Rule of thumb
- if you fix it in optics, you won’t fight it in code.
Resolution Matters
To detect a 0.2 mm defect, aim for ≤0.1 mm/pixel. Compute it simply: mm per pixel = field-of-view width (mm) / image width (pixels). If you can’t hit the target, tighten the FOV, choose a higher-res sensor, or use telecentric optics.
Use Cases / Where Object Detection Excels
- Assembly verification: Missing screws or clips, wrong gasket size, connector mismatches.
- Packaging and labels: Skewed labels, missing date codes, wrong variant artwork, cap tilt.
- Surface quality: Dings, dents, scratches on painted or metallic surfaces (often paired with segmentation).
- Count and kit checks: Verifying all components in a kit, counting items in trays.
- Electronics: Presence of components on PCBs, misplaced connectors; combine with AOI for solder-level defects.
- Food and beverage: Fill level with 3D, misapplied tamper bands, incorrect color caps.
Real-world snapshots:
- Automotive: 90 ms checks for wrong bolt class and torque witness marks at station.
- CPG: Catching skewed labels before case packers to avoid pallet-level rework.
- Pharma: Verifying presence and legibility of lot/expiry marks with audit-ready logs (GAMP 5/Annex 11/21 CFR Part 11 considerations).
A Practical Roadmap to Production
- Define the business problem
- KPI clarity beats model accuracy claims. Track escape rate (PPM), overkill rate, cycle time impact, and rework cost.
- Capture representative data
- Start by capturing representative data, sampling across different shifts, suppliers, and seasonal lighting conditions. Don’t forget to include ‘near-miss’ defects, as they provide critical insight for improving detection models.
- Lock down optics and fixturing
- Stabilize the scene. Consistency in part pose beats clever code. Add simple guides if needed.
- Label with intent
- Create an annotation guide. Boundaries for what counts as a defect matter. Review 5–10% of labels; version your datasets.
- Prototype offline, then pilot in-line
- Bench tests are for feasibility; pilots are for reality (vibration, dust, operator workflows). Don’t skip the pilot cell.
- Close the MLOps loop
- Automate sample capture, model versioning, A/B tests, rollback, and monitoring for drift. Schedule periodic “golden runs.”
- Integrate tightly with controls/MES
- Pass/fail with codes, part IDs, and images should land in your MES/quality data lake. Tie decisions to serial numbers for traceability.
- Validate and document
- For regulated industries: URS/FS/DS, IQ/OQ/PQ, and electronic records compliance (Part 11). For everyone else: a lean version of the same discipline.
Data and Labeling Tips from the Floor
- Curate edge cases: Damaged labels, partial occlusions, oily surfaces.
- Balance classes to avoid “all good” bias.
- Include hard negatives: things that look like defects but aren’t.
- Choose the right granularity: Boxes (fast, easy), polygons (precise), or pixel masks for surface issues.
- Use consensus labeling for subjective defects; align definitions with engineering and quality.
Lighting and Fixturing Tricks
- Polarizers to kill glare on glossy plastics and metals.
- Darkfield rings for micro-scratches on brushed aluminum.
- Backlight to confirm presence/shape; great for gasket integrity.
- Cleanliness routine: scheduled lens and light cleaning changes everything.
Measuring Success Beyond “Accuracy”
“Accuracy” hides the pain. Use metrics that map to money and risk:
- False negatives (escapes): The costliest failure. Measure in PPM and dollars per escape.
- False positives (overkill): Kills throughput and morale; measure rework cost and OEE impact.
- Precision/recall and F1: Tune your threshold to the business (safety-critical vs cosmetic).
- Latency and uptime: Decision time and system availability.
- MSA for vision: Stability across time, operators, and lots. Use repeated runs on “golden” and “worst acceptable” parts.
- Process capability tie-in: If your process drifts, vision KPIs will drift too. Monitor both.
Drift is inevitable — prepare for it with systematic monitoring
- Data drift: New supplier? Different pigment? Expect shifts.
- Concept drift: New defect types after a tooling change.
- Watch confidence distributions, drift in false negatives/positives, and the rate of manual overrides.
- Retrain on a schedule or by trigger (e.g., when FP/FN crosses a threshold). Keep rollback handy.
Common Pitfalls (And How to Avoid Them)
- Launching without enough bad samples: Mitigate with synthetic data or domain randomization — but keep collecting real defects.
- Ignoring changeover complexity: Mixed-model lines demand robust part detection and recipe management.
- Overlooking operator experience: Provide clear visuals and reasons for fail; avoid “black box” frustration.
- Poor integration: If your vision can’t talk cleanly to PLC/MES, you’ll pay for it later.
- Vendor lock-in: Favor systems that export models and data, support standard protocols (OPC UA, MQTT), and offer on-prem/cloud options.
- Treating it as an IT project: It’s OT + IT + quality. Involve maintenance, controls, and QA early.
ROI Snapshot: A Simple Way to Frame It
Say you produce 100,000 units/day at $5 contribution margin. Current escape rate is 150 PPM with an average claim cost of $80 per escape. Overkill is 1% with $0.25 rework cost.
- Annual escape cost ≈ 100,000 × 0.00015 × $80 × 250 days = $300,000
- Annual overkill cost ≈ 100,000 × 0.01 × $0.25 × 250 days = $62,500
If object detection halves escapes and overkill, you save roughly $181,250 per year. That’s before scrap reduction, brand protection, and operator time saved. Many projects pay back in under a year, especially on high-volume lines.
What’s Next: From Detection to Predictive Quality
- Unsupervised anomaly detection for early warnings on novel defects.
- Few-shot learning to adapt quickly to new SKUs.
- Synthetic data from digital twins to cover rare edge cases.
- Sensor fusion (2D + 3D + thermal) for robust decisions.
- Better explainability: heatmaps and feature attribution so quality teams trust the calls.
- Fleet management: centrally monitor dozens of cells, push models, and audit outcomes.
Practical Tips You Can Use
- Walk the line at shift change; collect “ugly” images — glare, dust, slight misalignments.
- Do a 30-minute lighting test: backlight, darkfield, cross-polarization. Pick the one that amplifies your defect the most.
- Calculate pixel resolution against your smallest meaningful defect; adjust optics or FOV.
- Draft a one-page annotation guide and try it with two labelers; compare results.
- Set thresholds with real costs in mind: for safety-critical parts, bias toward recall; for cosmetic issues, favor precision.
FAQs: Object Detection in Manufacturing Quality Control
Q. How do I know if object detection in manufacturing will work for my defect or part?
Start with two quick checks: resolution and lighting.
- Resolution: Your smallest defect should be at least 3–5 pixels across (aim ~0.1 mm/pixel to catch a 0.2 mm defect). Tighten field of view or use a higher-res sensor if needed.
- Lighting: Do a 30-minute bake-off (backlight, darkfield, cross-polarized). Keep the setup that exaggerates the defect.
- If the issue is subtle texture or glare-driven, pair detection with segmentation or 3D for height/warp.
Q. Do we need thousands of “bad” images to train a reliable model?
No. You can start strong with a lean, intentional dataset.
- Begin with 300–800 “good” images and 30–150 representative defects; add “near-misses” and hard negatives.
- Use augmentation (exposure, blur, rotation) and, if needed, synthetic data to cover rare cases—then replace with real defects over time.
- Close the loop: capture every fail/pass image on the line and retrain periodically. Active learning speeds this up.
Q. What hardware do we actually need on the line?
Think optics first, compute second.
- Camera: Global shutter for motion; line-scan for webs/continuous materials. Color only if color is a feature.
- Lens: Telecentric for gauging; standard C-mount otherwise.
- Lighting: Backlight (presence/shape), darkfield (scratches), cross-polarized (glare). Keep lenses/lights clean on a schedule.
- 3D: Structured light or laser triangulation for height/warp.
- Compute: Edge inference on an industrial PC/Jetson-class device; target <100 ms trigger-to-decision. Integrate with a clean I/O handshake.
Q. How do we integrate with PLC/MES and maintain traceability?
Treat vision like any other critical station.
- Output: Pass/fail, defect type, location, confidence, and cycle time.
- Protocols: OPC UA/MQTT/REST to PLC/SCADA and MES; attach results to serial numbers via scanners.
- Storage: Save images + metadata to your quality data lake/SQL with model and recipe versions.
- Regulated? Follow URS/FS/DS, IQ/OQ/PQ, and keep audit trails (21 CFR Part 11/Annex 11, GAMP 5).
Q. How should we measure success and tune thresholds?
Measure what maps to money and risk, not just “accuracy.”
- Escapes (false negatives) in PPM and dollars/claim; Overkill (false positives) and OEE impact.
- Precision/recall and latency/uptime. Bias thresholds to the use case: safety-critical = favor recall; cosmetic = favor precision.
- A/B test model versions on live traffic; review “golden” and “worst acceptable” parts weekly.
Q. What does ongoing maintenance look like after go-live?
Plan for drift and make updates routine, not heroic.
- Monitor: FP/FN rates, confidence distributions, operator overrides.
- Triggers: Retrain when metrics cross thresholds or new SKUs/suppliers arrive; run weekly “golden runs.”
- Governance: Version models/recipes, enable instant rollback, and document changes. Keep optics clean—cheap wins beat clever code.
Conclusion: Object Detection in Manufacturing Quality Control
Object detection is no longer an experimental tool — it’s a core component of modern manufacturing quality control. When paired with the right optics, lighting, data pipeline, and MES/PLC integration, it delivers measurable improvements in defect detection accuracy, cycle time, and overall equipment effectiveness. Manufacturers that treat vision systems as a continuously improving quality ecosystem — not just a point solution — see the strongest ROI and the most stable production outcomes.
If you’re considering automated visual inspection, begin with a focused use case, validate performance under real line conditions, and scale using data-driven insights.
Ready to bring AI-enabled quality control and object detection into your manufacturing line? Visit ML.Techasoft.com to explore real-world case studies, demos, and AI solutions for high-speed production and defect detection.


Leave a reply